
Scientific papers are meant to communicate knowledge clearly, precisely, and convincingly. Yet many papers still struggle with one major problem: they explain dynamic processes with static content.
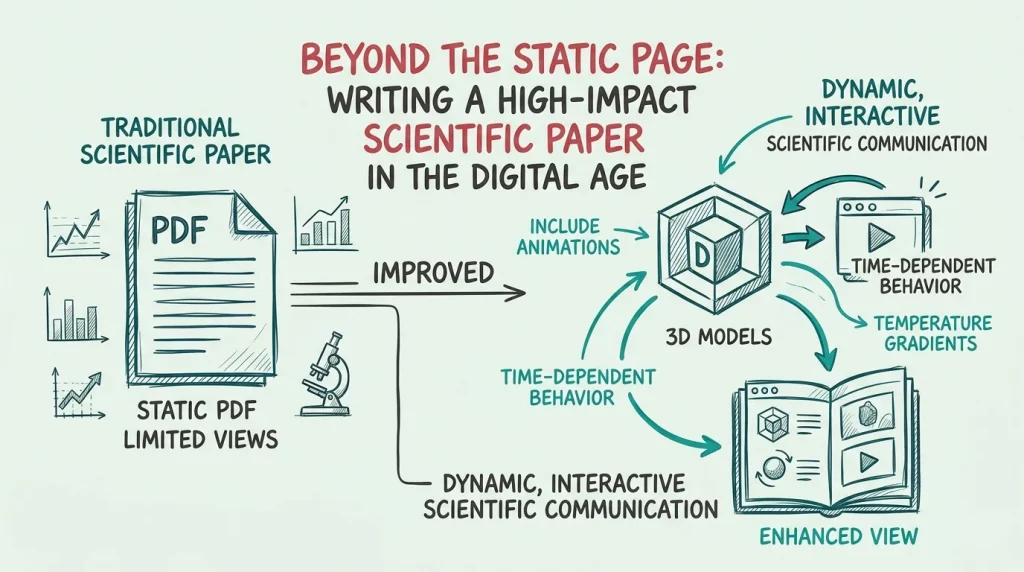
If your research involves time dependent behavior, temperature changes, simulations, molecular movement, mechanical transformations, or 3D structures, a sequence of images inside a PDF is often not enough. Readers must mentally reconstruct what happens between figures, which increases cognitive load and reduces clarity.
In this guide, you will learn the most important principles of writing a strong scientific paper, how to structure your work effectively, and how modern interactive elements such as animations and 3D models can significantly improve scientific communication.
Why Writing a Good Scientific Paper Matters
A scientific paper is not only a documentation of results. It is a communication tool.
Even groundbreaking research can be overlooked if the paper is difficult to understand, poorly structured, or visually confusing. Strong scientific writing helps you:
- Explain complex ideas clearly
- Increase readability and citation potential
- Improve peer review outcomes
- Make your work accessible to interdisciplinary audiences
- Present data more convincingly
A good paper guides the reader logically from the problem to the conclusion.
The Core Structure of a Scientific Paper
Most scientific papers follow a standardized structure. Understanding the purpose of each section is essential.
Title
Your title should be:
- Specific
- Descriptive
- Searchable
- Concise
Avoid vague titles. Instead of:
“Investigation of Thermal Effects”
Use:
“Analysis of Temperature Dependent Material Deformation Under Cyclic Thermal Stress”
This improves discoverability in search engines and academic databases.
Abstract
The abstract is often the most read section of your paper.
A strong abstract briefly answers:
- What problem did you study?
- Why is it important?
- What methods did you use?
- What were the key findings?
- What is the significance?
Keep it compact and information dense.
Introduction
The introduction establishes context.
A good introduction should:
- Explain the broader problem
- Review existing research
- Identify the research gap
- Present your objective or hypothesis
This section should convince readers why your work matters.
Methodology
The methodology must be reproducible.
Readers should understand:
- Materials used
- Experimental setup
- Simulations or computational models
- Measurement procedures
- Analytical methods
Clarity is more important than sounding overly complex.
Results
This section presents your findings objectively.
Use:
- Graphs
- Tables
- Images
- Simulations
- Comparative visualizations
Avoid interpreting every result immediately. Focus first on presenting the data clearly.
Discussion
The discussion explains the meaning of the results.
This is where you:
- Interpret findings
- Compare with previous studies
- Explain limitations
- Discuss implications
Strong discussions are analytical, not repetitive summaries.
Conclusion
Your conclusion should summarize:
- The core findings
- Their scientific relevance
- Potential future research directions
Keep it focused and avoid introducing new information.
The Most Common Mistake in Scientific Papers
One of the biggest weaknesses in modern scientific publishing is the reliance on static visuals for dynamic information.
Researchers frequently attempt to explain:
- Fluid dynamics
- Mechanical movement
- Chemical reactions
- Heat distribution
- Temporal simulations
- Structural transformations
using only multiple screenshots or image sequences.
This often creates confusion.
Readers must mentally interpolate the missing transitions between figures.
Why Interactive Scientific Content Improves Understanding
Interactive scientific documents allow readers to directly explore data instead of passively interpreting static snapshots.
This becomes especially valuable when presenting:
- Time dependent simulations
- Temperature evolution
- Particle movement
- 3D geometries
- Medical imaging
- CAD models
- Engineering processes
Instead of showing ten separate images, you can embed:
- Animations
- Videos
- Interactive 3D models
- Simulations
- Rotatable structures
directly inside the reading experience.
This creates a far more intuitive understanding of the research.
How Researchers Can Use Interactive Elements in PDFs
Traditionally, integrating dynamic content into scientific papers has been technically difficult.
Many solutions require:
- Specialized PDF standards
- Large file sizes
- Software compatibility issues
- Complex workflows
Modern web based document solutions simplify this significantly.
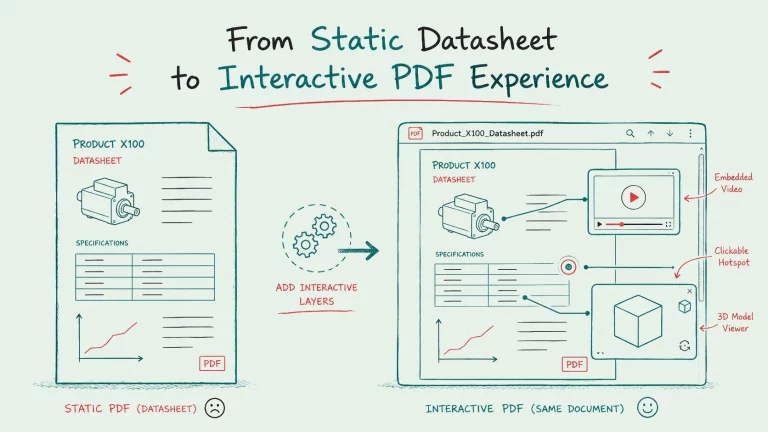
With Viewnamic, researchers can enrich scientific PDFs with dynamic content without modifying the original document itself.
The PDF remains unchanged, while interactive elements are layered seamlessly into the viewing experience.
This allows authors to integrate:
- Simulation videos
- Animated processes
- Interactive 3D models
- Clickable prototypes
- Time dependent visualizations
directly into scientific documents.
Example: Scientific Visualization With Interactive Content
A strong example of interactive scientific communication can be seen in this scientific document viewer:
Interactive Scientific PDF Example
Instead of relying purely on static figures, the document integrates dynamic visual content directly into the reading flow.
This is especially useful for:
- Engineering simulations
- Physical processes
- Material science
- Biomedical visualization
- Computational research
Readers can understand behavior and transitions much faster than with image sequences alone.
Best Practices for Writing a High Quality Scientific Paper
Focus on Clarity Over Complexity
Many researchers mistakenly believe complicated writing sounds more scientific.
In reality, the best scientific papers are easy to follow.
Avoid:
- Unnecessarily long sentences
- Excessive jargon
- Redundant explanations
Your goal is communication, not complexity.
Use Visuals Strategically
Good visuals improve comprehension dramatically.
Use:
- Clear graphs
- Consistent labeling
- Readable axis titles
- Simplified diagrams
- Interactive content where appropriate
Every figure should support a specific argument.
Think About Reader Experience
Ask yourself:
Can someone understand my research efficiently?
Modern readers scan documents quickly. Strong structure and visual communication matter more than ever.
Make Your Research More Memorable
Interactive content increases engagement and retention.
Readers are far more likely to remember:
- An animated simulation
- A rotatable 3D structure
- A visual process demonstration
than a series of static screenshots.
This can improve not only readability but also the perceived quality of your work.
The Future of Scientific Publishing Is Interactive
Scientific communication is evolving.
Researchers increasingly work with:
- Simulations
- Computational models
- Digital twins
- Time dependent datasets
- Spatial data
Static PDFs alone are no longer ideal for representing these kinds of information.
Interactive scientific documents bridge the gap between traditional publishing and modern digital communication.
For researchers, this creates new opportunities to:
- Explain results more clearly
- Increase engagement
- Improve accessibility
- Differentiate their publications
- Enhance presentations and supplementary material
Final Thoughts
Writing a good scientific paper is about more than following a template.
The strongest papers combine:
- Clear structure
- Precise writing
- Logical argumentation
- Effective visualization
And increasingly, modern scientific communication also benefits from interactive elements that help readers truly understand dynamic processes.
If your research includes movement, simulations, temperature changes, or complex 3D structures, consider going beyond static figures.
With Viewnamic, you can transform traditional PDFs into interactive scientific experiences that communicate your research more effectively and make your work stand out.
Last updated:
Publish your PDFs with Viewnamic
Host, share and enhance your documents – free for 30 days.